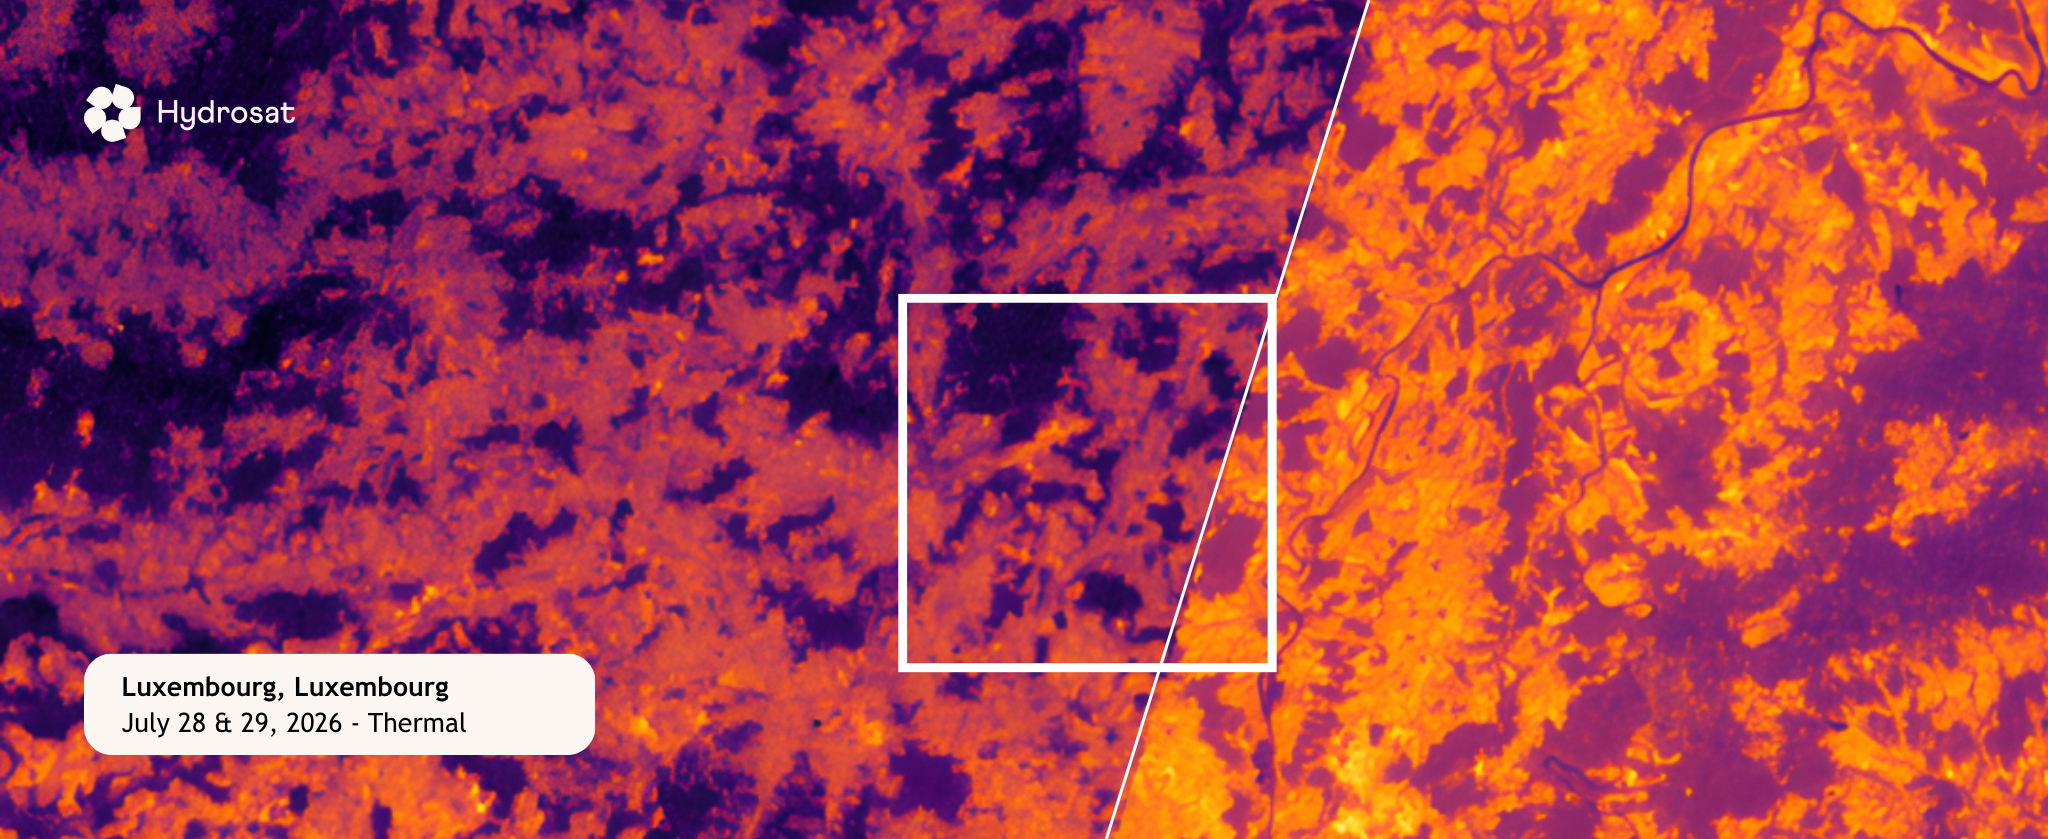
Extreme heat is the leading cause of weather-related deaths worldwide. More than half a million people die from heat-related causes globally each year [Romanello et al., 2025], and heat-related mortality is expected to rise sharply as heat waves become more frequent, intense, and prolonged.
In 2024, surface temperatures in parts of India exceeded 80°C (176°F), while extreme heat in cities around the world contributed to road deformation, electrical equipment failures, and dangerous conditions for people without adequate access to cooling.
As cities grow and infrastructure becomes more concentrated, effective urban heat monitoring is becoming increasingly urgent. Understanding where heat accumulates and who is most exposed, however, requires more than measuring a citywide average.
Urban heat is highly localized
Cities are often significantly hotter than their surrounding landscapes, in some cases by as much as 9°C. This urban heat island effect is shaped by the way concrete and asphalt absorb and re-emit solar energy, the limited presence of vegetation, and heat generated by vehicles, buildings, and industrial activity. Dense construction can also restrict airflow, preventing heat from dissipating [Rizwan et al., 2008].
These conditions can vary considerably within the same neighborhood. Roads, rooftops, parking lots, schools, parks, and shaded areas may all exhibit very different temperatures across distances of only a few tens of meters.
This uneven distribution matters. The effects of extreme heat depend not only on location, but also on infrastructure, building materials, access to vegetation, and the availability of cooling resources.
Consequently, lower-income and historically underserved communities can experience disproportionately severe urban heat exposure [White-Newsome et al., 2009; Agatep et al., 2026]
Measuring heat requires more than one indicator
There is no single measurement that fully captures how extreme heat affects people and cities.
Surface temperature helps identify where roads, roofs, and other materials are accumulating heat. Air temperature and humidity determine the apparent temperature people experience [Nguyen et al., 2014]. Daytime peaks reveal acute exposure, while nighttime temperatures show whether buildings and neighborhoods can release the heat absorbed during the day. The number of consecutive days above a given threshold also influences health risks [Williams et al., 2019].
Ground-based sensors provide valuable localized measurements of air temperature and humidity, but they are not distributed evenly across cities.
Thermal infrared satellite data offers a complementary view by measuring surface temperature consistently across large areas [Fisher et al., 2020; Fisher et al., 2026b].
Used together, these sources can provide a more complete understanding of how heat develops and persists across an urban environment.
Why spatial resolution matters
Urban features generally exist at scales of tens of metres. If a thermal pixel contains part of a road, building, tree canopy, and shaded area, the resulting temperature represents a mixture of those surfaces. Important, localized differences may disappear [Fisher et al., 2026a].
Government missions such as Landsat and ASTER have provided thermal observations at approximately 100 m for decades, while ECOSTRESS has brought this closer to 70 m. While these datasets have been instrumental in advancing urban heat research, their resolutions remain close to the limit required to distinguish many individual urban features.
New commercial thermal capabilities are bringing observations to much finer scales. This new generation of thermal Earth observation can reveal localized hotspots, differences between surface materials, and temperature patterns across transportation corridors, parks, buildings, and critical infrastructure.
Heat waves also demand frequent observations
Spatial detail alone is not enough. Heat waves evolve quickly and last, on average, around four days. A satellite that observes the same location less frequently may miss an entire event.
Each Landsat satellite has a 16-day repeat cycle. Landsat 8 and Landsat 9 operate with an eight-day offset, improving combined coverage but still potentially missing short-duration heat events [USGS, 2026]. ECOSTRESS provides observations at approximately 70 m with a variable revisit of around three to five days, bringing thermal monitoring closer to the cadence needed to observe rapidly changing conditions [Fisher et al., 2020].
Building on this foundation, Hydrosat’s current on-orbit thermal capability already provides a vital layer of continuity for urban heat monitoring. To further improve the capture of the intensity and evolution of heat waves, higher resolution and more frequent revisits are imperative. This is the driving force behind Hydrosat’s planned next-generation constellation—designed to combine daily revisit with 25 m GSD thermal infrared data and coincident 10 m GSD visible + NIR imagery. This step-change in spatial and temporal resolution will support more consistent monitoring of fast-moving heat events – not only showing where heat is concentrated, but also how those conditions change throughout an event.
No single sensor will answer every urban heat question. Hydrosat data will be most valuable when used alongside government missions, other commercial systems, ground measurements, and local knowledge.
Turning thermal observations into local action
The objective is not simply to produce a clearer map of urban heat. It is to help communities and governments determine where intervention is most urgent and evaluate whether those interventions are working.
Potential measures include expanding tree cover and parks, introducing ponds and other water features, applying reflective coatings to streets and rooftops, improving shade, ventilation, and insulation, and opening cooling centres during extreme events.
In Los Angeles, remote sensing has shown how changes such as street-surface recoating can produce immediately detectable temperature differences. Community-based research led by Hydrosat’s Science Lead Dr. Joshua B. Fisher also trained residents in southeast Los Angeles to compare ECOSTRESS observations with handheld thermal measurements.
The work helped identify local hotspots and brought community members, researchers, and government officials together to discuss the unequal distribution of urban heat and potential policy responses. This type of collaboration is essential. Thermal data can identify patterns, but communities provide the knowledge needed to understand who is affected, why the pattern exists, and which responses are realistic.
Building an evidence base for urban heat resilience
Urban heat cannot be managed as a citywide average. Its effects are local, unevenly distributed, and closely connected to infrastructure and access to cooling resources.
High-resolution, frequently updated thermal data can give cities a stronger evidence base for action: identifying priority areas, monitoring rapidly changing conditions, directing resources, and measuring whether investments in vegetation, shade, reflective materials, and infrastructure improvements are producing meaningful results.
Hydrosat’s expanding thermal capabilities are part of a broader shift toward more operational urban heat monitoring. Combined with government and commercial observations, ground measurements, community expertise, and public policy, these data can help cities move from periodically studying extreme heat to managing it more consistently and effectively.