Sea surface temperatures across the equatorial Pacific have climbed steadily since the spring, and by June 2026 the U.S. National Oceanic and Atmospheric Administration (NOAA) had issued a formal El Niño Advisory, putting the odds at better than three in five that the event intensifies into a “very strong” El Niño by fall. Some forecasters are already calling it a Super El Niño, with a handful of models suggesting it could rival the most intense event since global record-keeping began in 1950.
For most people, that registers as a warmer winter or a wilder storm season. For a maize farmer in Malawi or a water manager in the Colorado River basin, it registers as a countdown, with an ocean some may never see setting the terms for how much water reaches their fields this year.
A Simple Ocean Pattern With Global Reach
El Niño is one phase of a recurring pattern called the El Niño-Southern Oscillation, or ENSO, which shifts irregularly every two to seven years between warm (El Niño), cool (La Niña), and neutral states. Trade winds normally push warm Pacific water westward toward Indonesia, however during El Niño they weaken or reverse, sending warm water back toward the central and eastern Pacific instead.
Because the Pacific covers a third of the planet’s surface, that shift reorganizes the atmosphere above it, moving rainfall and storm tracks thousands of miles away, drying Indonesia’s rainforests while flooding coastal Peru.
What the Historical Record Shows
Economists tie the 1997-98 event, the strongest El Niño of the twentieth century, to roughly $5.7 trillion in lost global income. The slightly weaker 1982-83 event cost about $4.1 trillion, as crop failures, disease and wrecked infrastructure worked through economies long after the Pacific itself had cooled.
In 2023-24, Southern Africa went through its driest stretch in over a hundred years, and by the Food and Agriculture Organization of the United Nations’ count, 61 million people ended up needing assistance, with 8 million pushed into acute food insecurity. Malawi alone lost or damaged nearly 750,000 hectares of maize, the crop that fills two out of every three calories most Malawians eat, and drought killed more than 9,000 head of cattle across Botswana, Namibia, Zambia and Zimbabwe as herders ran out of water and grazing. This time the baseline is different, with oceans already warmer than they were heading into 2015-16 or 1997-98.
Where the Water Runs Short
Drought is where El Niño’s damage concentrates, but rarely because rain stops arriving altogether. More often a rainy season starts late, ends early, or drops half its usual total during the exact weeks when crops need it most. The FAO tracks this in real time through its Agricultural Stress Index System, built on four decades of satellite imagery; the Sahel, Southern Africa, South and Southeast Asia, and Central America’s Dry Corridor all show farmland where drought is more likely than not this year.
Reservoirs and rivers draw down water first, responding directly to rainfall deficits. Groundwater follows on a longer lag, as farmers and municipalities pump more to offset the shortfall. Soil moisture often falls fastest of all, sometimes weeks before a drought is visible, since crops draw on whatever moisture remains in the root zone long after rain has stopped.
By the time stress is visible, yield loss is usually already baked in. Southern African growers in the worst-affected countries brought in roughly half a normal harvest in 2023-24, Haiti fared even worse in 2015-16, when crops fell by up to seventy percent and the number of people going hungry roughly doubled within a season.
Crop failure erodes household income right as food prices climb, and livestock, often a family’s main store of wealth, gets sold at distressed prices or dies outright. Layer conflict or chronic food insecurity on top, as is already true across the Sahel and Horn of Africa, and a moderate rainfall deficit can tip into a humanitarian emergency well before anyone would call it a famine.
We Already See It Coming
The harder problem has always been seeing these local impacts early enough to act before losses are locked in. Ground networks (rain gauges, river gauges, soil moisture probes) are reliable where they exist, but they often exist unevenly. The Sahel, the Andean highlands and rural South Asia have a fraction of the stations the American Midwest takes for granted, and where stations exist, data often reaches a regional office weeks later, after a planting window has closed.
Satellite-based earth observation has narrowed that gap, tracking rainfall, land surface temperature and vegetation condition at a resolution that would once have required a much denser ground network. That’s the logic behind FAO’s anticipatory action work. Ahead of the 2023-24 drought, the agency and its partners moved roughly $31 million into seven Southern African countries for drought-resistant seeds, livestock support and early warning systems, months before the emergency hit, because the forecast gave them time to move first.
What Thermal Infrared Adds to the Picture
Rainfall and vegetation greenness describe supply, how much water has arrived, but say less about demand, such as how much crops are losing to the atmosphere. That demand side is measured through evapotranspiration, evaporation from soil plus transpiration from plants, and it’s where thermal infrared imaging has become particularly valuable. Water-stressed vegetation cannot cool itself as effectively through transpiration and runs measurably hotter than a well-irrigated crop, often days before that stress is visible to the eye or shows up in standard vegetation indices.
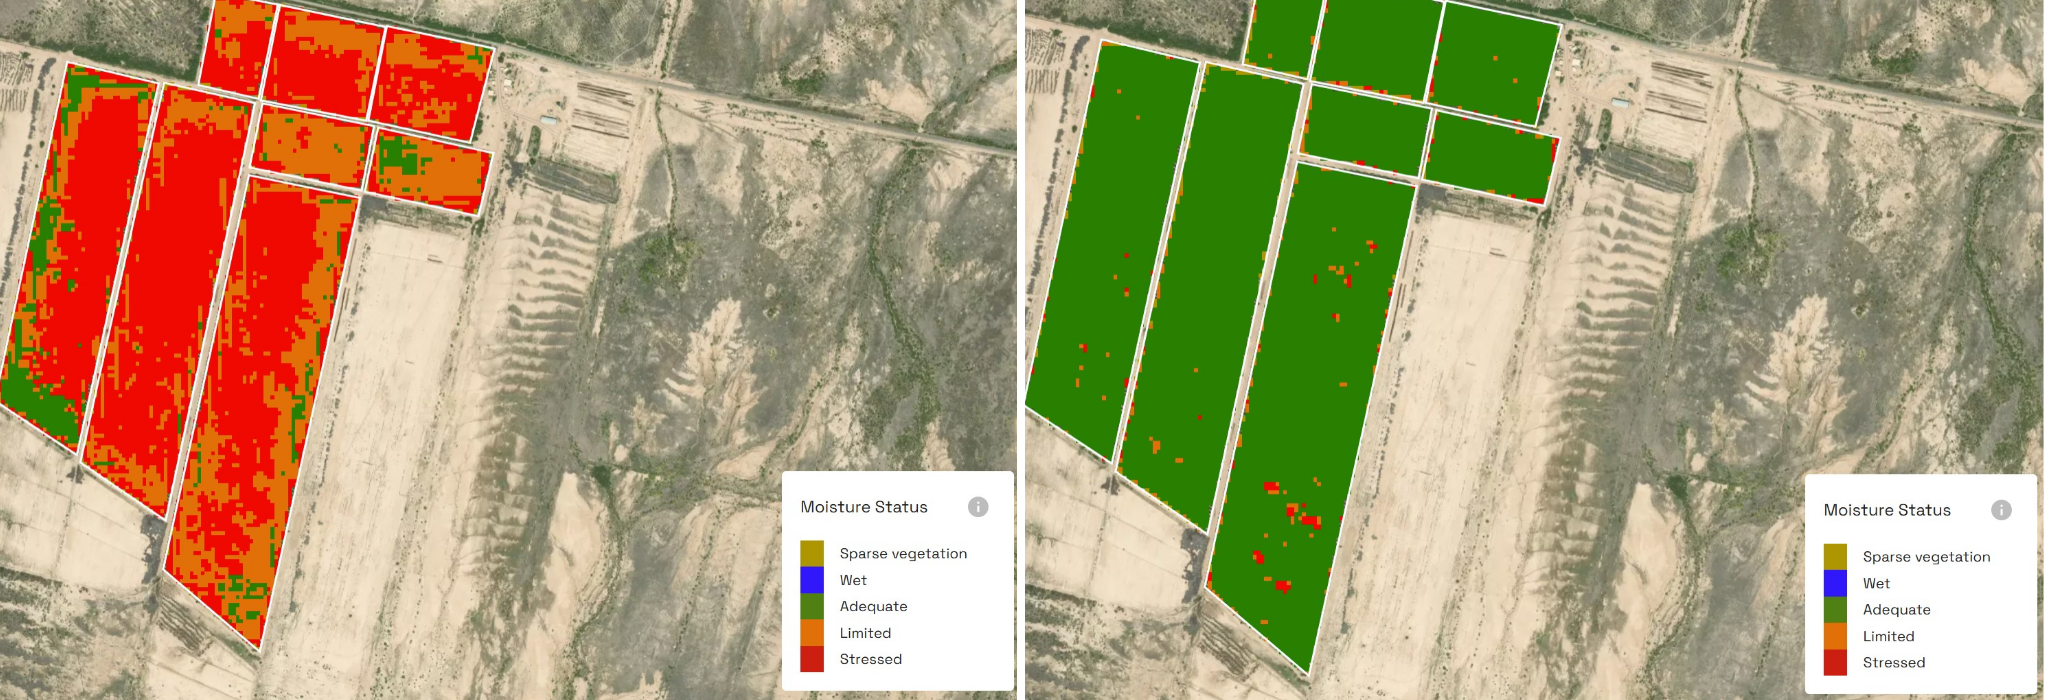
Satellites carrying thermal infrared sensors, including NASA’s ECOSTRESS and Hydrosat’s VanZyl-1, now track that signal at a field-relevant scale and update it daily, a level of responsiveness that provides real advantages over less frequent monitoring. Hydrosat feeds that data into its IrriWatch platform, giving farmers, agribusinesses and governments a running picture of soil moisture trends, crop water stress and water use efficiency. The value is less a single reading than a trend line. Watching evapotranspiration diverge from seasonal norms gives water managers lead time measured in weeks, time that can go toward reservoir releases, irrigation priorities or targeted assistance before a drought becomes a crisis.
A Wider Swing Ahead
Whatever strength this El Niño reaches, it’s unlikely to be the last major one. Climate projections point toward more frequent swings between strong El Niño and La Niña extremes as ocean temperatures rise. What’s harder to debate is that the populations most exposed, smallholder farmers, pastoralists and rural water managers across the Sahel, Southern Africa, South Asia and Central America, have the thinnest financial cushion to absorb a bad season.
Building resilience depends less on forecasting the ocean with perfect precision than shortening the distance between a forecast and a decision. Satellite monitoring has already reduced that distance from months to weeks in places that never had reliable ground networks. The real test through the rest of 2026 is whether that lead time gets used. Whether seeds, water, credit and cash assistance reach the communities already identified as most at risk before the rains fail, rather than after.
Figures here draw on NOAA, FAO and other cited sources through late June 2026. El Niño is an evolving pattern, and conditions may have shifted by publication.